
Essential Characteristics That Lead to Elite-Performing Engineering Teams

If you manage one or more engineering teams like me you likely struggle with the following question. How can I help guide my team to continually improve? Recently I stumbled across some research from the DevOps Research and Assessment (DORA). This assessment has findings from its over six years of research into this topic.
Amongst its findings were a set of common characteristics that appeared in elite performing teams. When compared against the low performing teams it was discovered that these elite performing teams actually had some very measurable differences appear:
- Execute 208 times as many code deployments
- Maintain lead times, from commit to deploy, that are 106 times faster
- Report change failure rates that are 7 times lower
- Recover from change failures 2,604 times faster
A bit surprising? At this point it may be worth the time to step into these performance metrics in more detail, and look into defining them.
Key Metrics
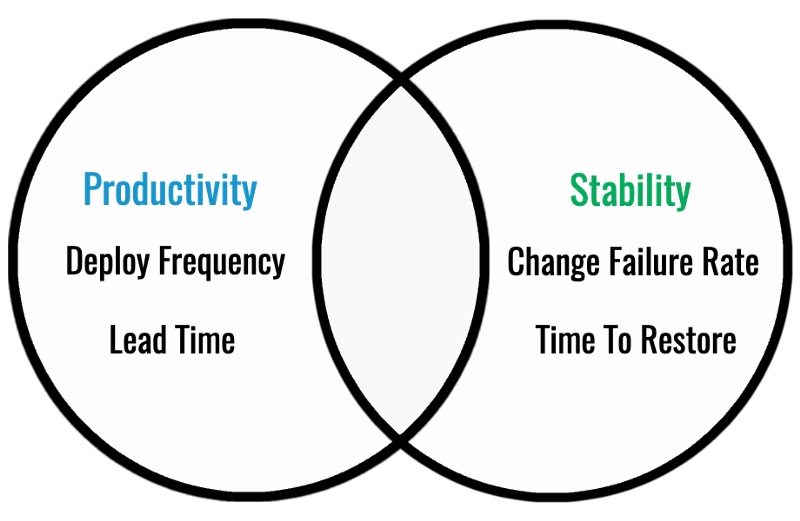
At the end of the day your teams performance is judged on two things. The rate at which you deploy your changes to production, and the stability of your system. Usually these two actions are at odds with each other, but the way in which these are defined synergies start to appear when it comes to behaviors that would be developed through the effort of improving them.
Productivity
There are two key metrics tied to productivity, but when measuring performance towards these drive teams to create habits that make for more stable deployments.
Deployment Frequency (⬆)
This is a measure of how often a team successfully releases to production. This is actually the easiest for most teams to collect, and measure if you have continuous integration and deployments (CI/CD) in place. Our team has started collecting our Google Cloud Build logs so that we can easily start measuring this. The key driver towards success here is that the frequency of deploys is being measured as a success metric, and not the volume of code pushed. This will force your team to make smaller deploys to production which in turn make for more stable releases.
Lead Time for Changes (⬇)
This measures the amount of time it takes for a commit to get into production. This metric is actually surfaces through the delta between two events: the time between a commit for a feature, and it’s deployment into production. This one is a little more difficult to measure than the previous metric as there are two things to track, and the metric is the result of the delta between them. To measure this you must keep track of the timing of your commits staged in pre-prod environments, and then store the delta between those times after successfully deployed to production.
I am going to be honest our team has been dragging our feet on this a little, but that’s because we were tempted to consider the start of the lead time to be when a ticket for a proposed change is added to our backlog. I will report back on this one, but starting with a commit is likely your best first step towards measuring this in an automated fashion.
Stability
Change Failure Rate (⬇)
This measures the rate at which your team’s deployments are causing a failure in production. It’s calculated by getting the percentage of failed deployments against all attempted deployments. Our team is gathering some deployment information from our previously mentioned Cloud Build logs, and will be collecting metrics around incidents with each deployed version from our test suite, our quality of service jobs, and reported incidents.
Time to Restore Services (⬇)
Last but not least the metric fourth metric is measuring how long it takes your team to recover from a failure in production. This is a little more difficult to monitor. Our team’s plan is to feed all incidents into OpsGenie, and then measure the time between the resolutions of each incident. Alternatively, we are considering using our status dashboard software to measure these delta’s. In your case this can really use any incident management system. Most of the teams within our company likely could easily pull this off through a simple API integration with JIRA.
These metrics are surprisingly synergistic as likely your first reaction is to think the opposite. By measuring your team this way you all will start to discover that habits will start to surfacing that make your team more productive. Such as releasing much smaller, more frequent releases. Our team had been working towards a few of these, but without much success as we had been enforcing behaviors that wouldn’t contribute to all four metrics. The strength in these metrics are in the behaviors that appear only when working to improve all four. After reading through the research I have high hopes for using this north star as our team’s key performance indicators (KPI)’s.
Now What?
Before you start it may be worth quickly using the DORA DevOps Quick Check to get a baseline of your team’s software delivery performance. The cool thing about this tool is that it will also suggest DevOps capabilities that you can work on to improve your team’s performance.
Now that you know some well researched key metrics to evaluate for your team, it’s time for the next step. This step is to start collecting these metrics so that you can assess your teams current performance so that you can start directing your efforts. Assess then improve.
Once you are at a stage where you can assess your teams performance it’s time to display them for your team to see as these will be your guiding KPI’s. They need to be as ever present as your status dashboards. The DORA project actually has an open source setup script that will allow you to display these collected metrics within DataStudio.
GoogleCloudPlatform/fourkeys
Through six years of research, the DevOps Research and Assessment (DORA) team has identified four key metrics that…github.com
Conclusion
The typical engineering team will be judged by what they can successfully release to production. Elite performing teams are able to do this more frequently than the rest. Thanks to the DORA team we now have a well researched way to measure, and track our progress towards improving our performance, and drive engineering teams to be elite performers. There’s a lot more findings by this team, and a good book to read on this subject. I will leave links to the book, and some of those other findings below. Good luck on your own efforts towards building your own elite performing teams.
Resources
- Accelerate: The Science of Lean Software and DevOps Book (Builds on DORA, and based on input from more than 31,000 technology professionals worldwide)
- DORA Research
- DORA’s Four Key Performance Indicators
- Monitoring and observability
- Monitoring systems to inform business decisions
- Visual management capabilities
- A Decent Write Up On This Topic
More Posts By Dylan
Auto-Updating Your Github Profile With Python
Showcase Your Skills Through Automating Your Readme Profiletowardsdatascience.com
Create Beautiful Architecture Diagrams with Python
Stop spending time manually tweaking misaligned arrowstowardsdatascience.com
Deploy To Google Cloud Run Using Github Actions
A CI/CD Solution That Scales To Zero With Actions And Cloud Runtowardsdatascience.com
Enjoying these posts? Subscribe for more
Subscribe nowAlready have an account? Sign in